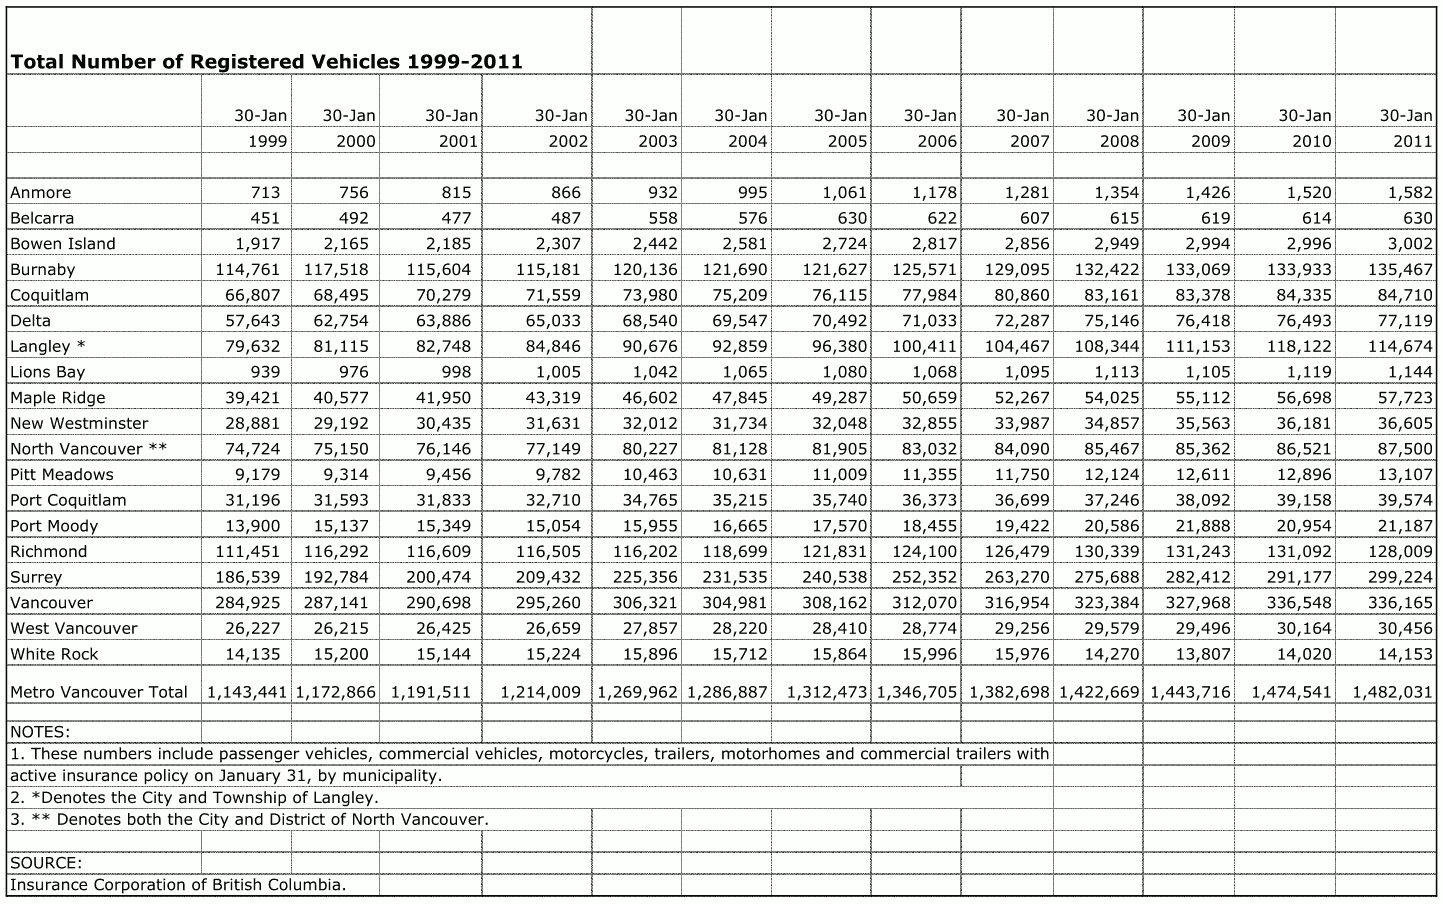
Our analysts came across an interesting document on the local South Fraser Blog that shows how many counted vehicles are registered in a given city in a Lower Mainland in a year, and associated patterns. The data compares over 12 years from 1999-2011 across all Metro Vancouver cities and districts. [LINK TO DOCUMENT]

This chart shows various interesting trends in transportation choices being made throughout the Lower Mainland.

In particular, where rapid transit routes were recently introduced, vehicle registration count either slowed down or reversed.
This is clearly happening in Richmond and the Canada Line SkyTrain line can be blamed for it. Whereas increases were recorded over the past few years almost consecutively, the counts began to drop in 2009 – the year the Canada Line was introduced. Surveys like this one [READ MORE] have shown that there are riders who are using the competitive Canada Line over the choice of driving; most of its riders value the speed, frequency and reliability of the service.
But perhaps one of the more interesting trend might be the one that can be seen in Surrey.
Metro Vancouver became host to an additional 338,590 vehicles in 12 years between 1999 and 2011. More than one third of these new vehicles were registered in Surrey alone.
Generally, the largest gains in vehicle registration counts have been recorded in Surrey, as more and more people are choosing to drive. In 10 years, vehicle registration counts went from being 90,000 distant to within 36,000 distant of Vancouver’s vehicle registration counts – and it is likely that they will soon surpass Vancouver’s.
The one year gap between January 2010 and 2011 fairly well defines Surrey’s problem as a fast growing city with a need for increased transportation facilities both in mass transit and for automobile use. Vehicle registration counts rose by 2.7% during this one year period in Surrey, and no other city recorded any gains nearly as high. The next highest raise in a larger city is that of Burnaby’s – which was only a 1.1% raise in vehicle registration counts.
Comparing over a 10 year gap, without a doubt Surrey has observed the fastest growth rate – from 200,000 to nearly 300,000 vehicles registered in the city – a 50% increase and an increase of 100,000 vehicles. No other city in the Metro Vancouver area has recorded gains this high over the 10 years period.

The data clearly shows that, perhaps frustrated over transit services or the lack of transit options to start with, new generations of citizens of the City of Surrey, whether children or new immigrants, are choosing to drive.
It is not out of place to be blaming the lack of competitive transit in Surrey, where in some cases what commute would require a 10-20 minute drive would require nearly 1 hour by current transit services, that may be more optimized for to-Vancouver than within-Surrey commutes.
The unfortunate reality is, only 6% of Surrey residents are using transit [STUDY] – and most certainly many are not using it for within-Surrey trips. Only few trips actually cross the Fraser River into Metro Vancouver, according to several studies and politicians; this may provide some explanation as to the low transit mode-share levels here.
Such a low rate not only impacts the city as a whole in that roads are seeing higher traffic counts and congestion than ever before, but it also impacts TransLink’s ability to economically provide such a service in Surrey.
With so few riders in the city as a whole riding transit, it can be expensive in that more subsidies as opposed to fare revenue are required to pay for the operation of these bus services alongside their drivers. This expenses the entire region – not just Surrey, but Metro Vancouver itself. Where routes in Surrey have high pass-up counts (i.e. more people want to ride transit here and there is larger demand), these pass-ups are happening within 5-6km of SkyTrain services.
With rapid transit, there is an opportunity to attract ridership and reduce these costs – but in Surrey, the right implementation type must be chosen and the new rapid transit must be competitive. This is exceptionally important.
There is clearly a need for rapid transit to better service Surrey’s busiest corridors – as well as bring both more reliable rapid transit and localized bus transit closer to a larger population, and encourage a largely automobile-commute-based population to take transit. The implementation must be a service that provides very competitive travel times with automobile travel.
So long as an implementation chosen is not going to be as competitive with the automobile, large chunks of potential riders can be lost – which can affect revenue and the ability to provide better transit service region-wide. Surrey’s roads which service lower densities and have lower congestion rates likely see faster average speeds than roads in Vancouver, encouraging the use of the automobile. This is evidenced by this map of collected data of transit route speeds published on another local transit blog called Voony’s Blog:

(Note that this map and the data appear to have been created before the introduction of the Canada Line to Richmond)
The fastest services on average in Metro Vancouver are clearly defined: the SkyTrain, the non-stop West Coast Express, and non-stop bus services mostly running on expressways. Not surprisingly, where capacity is provided and commute patterns fit, these services also observe the highest ridership counts of all routes in Metro Vancouver.
The map also shows that on average, Surrey’s local bus services appear to observe faster average speeds than Vancouver’s local services. The same is true for Richmond and other lower density communities.
We often concern ourselves as to whether light rail will be able to provide what Surrey needs: a competitive, economic transit service. With the 60km/h speed limit that all trains must obey on Surrey city streets and the much lower average speeds of the service, on-street light rail service might just not be able to do that.
As pointed out by the above data, the amount of people choosing to drive and the change in this trend that needs to happen should be very concerning to us Surrey citizens for several reasons.
