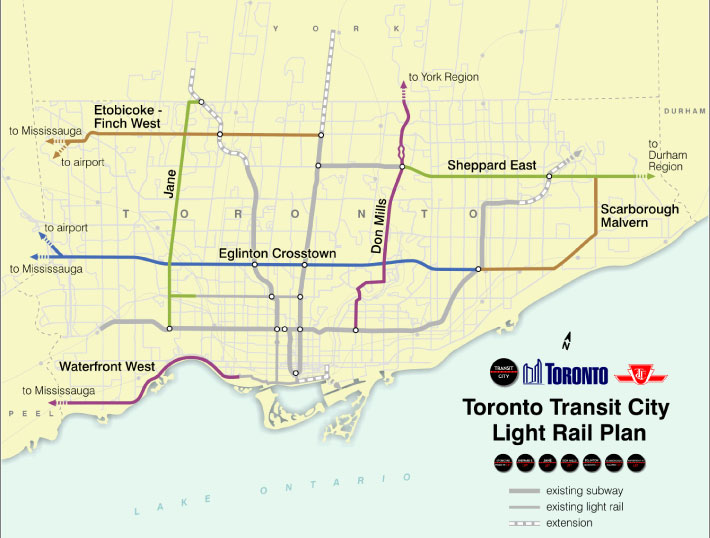
Now that an opening date is set for the Eglinton Crosstown LRT, attention has shifted from grand promises to the small operational choices that will shape daily commutes. After Finch West’s troubled rollout, one particular policy continues to draw the ire of critics and transit riders alike: the Toronto TTC requires LRT vehicles to slow from 60 km/h to 25 km/h when crossing intersections.
Commentators such as Reece Martin have called the rule arbitrary, and many transit riders read the mandatory slowdowns as an unnecessary time penalty carried over by the TTC (Toronto’s transit operator) from its legacy streetcar system.
But I have another theory: if we view the 25 km/h rule as an operational resilience choice, it actually starts to make sense.

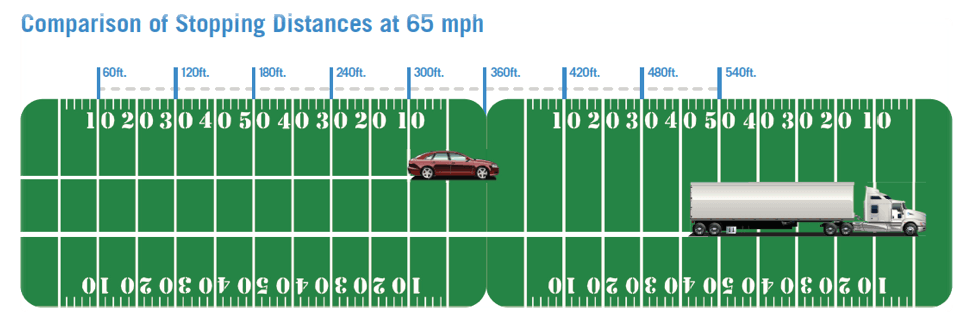
I’m sure we all know that trains take far longer to come to a stop than both cars and trucks—and at 25 km/h, an LRT has a much better chance of braking to avoid a collision. But at 60 km/h (full speed), collisions carry far more energy: they’re more likely to cause injuries or deaths, and severe vehicle damage or derailment, which in turn blocks the tracks for longer and compounds delays for other transit passengers.
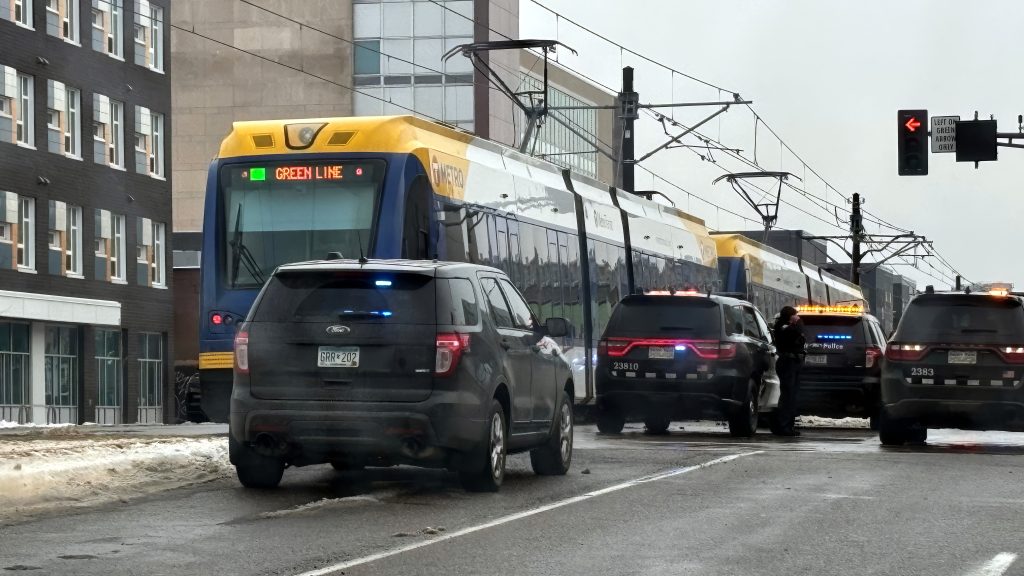
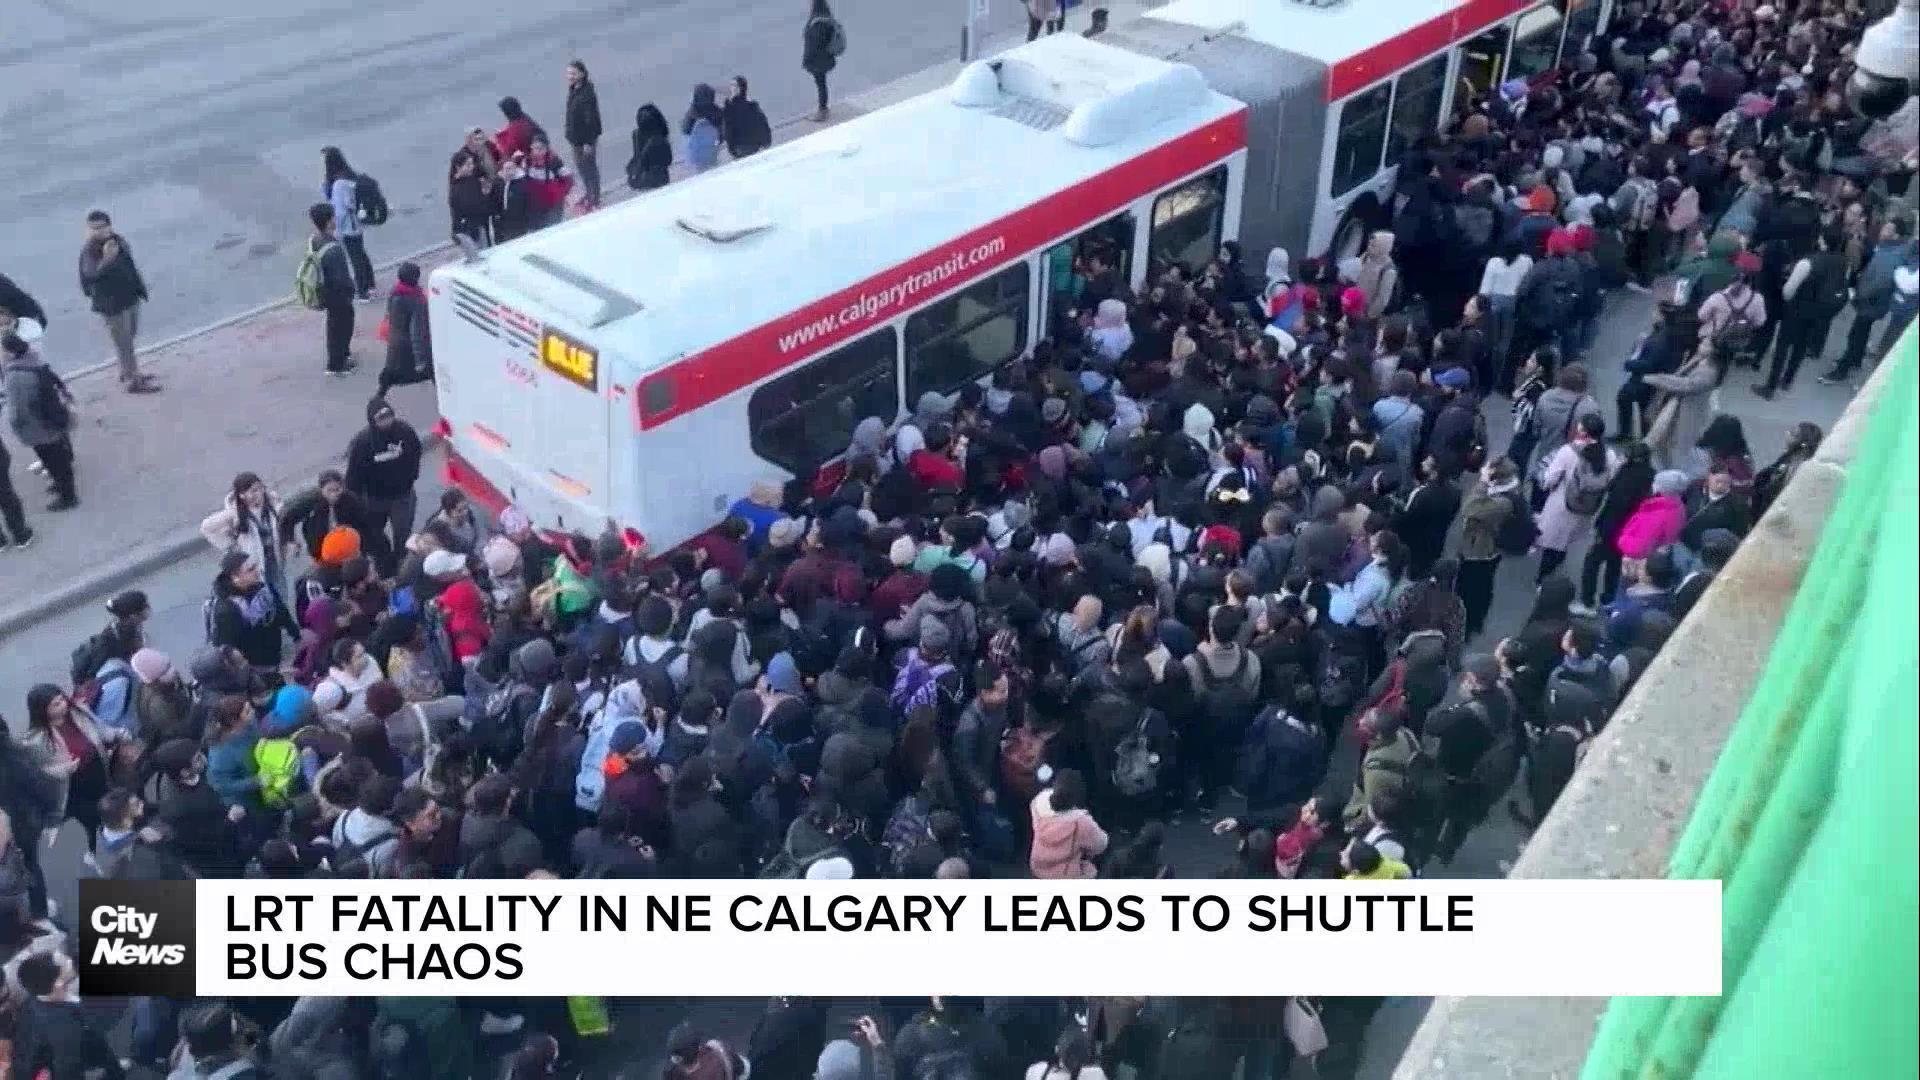
As we’ve seen in Calgary and Edmonton, a single collision can shut a line for hours; on a high‑capacity corridor like Eglinton, a similar event would strand thousands on tiny at‑grade platforms and force the TTC into a chaotic scramble for replacement buses. As such, what seems like an arbitrary choice actually raises an important question: are Torontonians and the TTC ready for catastrophic LRT shutdowns?

Now, I don’t mean to be alarmist and suggest that the Eglinton Crosstown and Finch West LRTs will be doomed to constant collisions with vehicles or pedestrians (although some North American LRT systems are certainly… certainly… having this problem). However, I will say that for the last 15 years, my organization has tracked vehicle‑train and pedestrian‑train incidents across North America.
Our work began as part of an effort to question LRT plans for Surrey, BC, but it has since produced broader planning lessons: at‑grade crossings create recurring risk, and the consequences of a blocked track are disproportionately large compared with the single incident itself. A derailment or a vehicle trapped on the rails doesn’t just delay one train—it can cascade through a corridor, multiplying delays.
Even if incidents average only a few times per month on any given system, the public impact is severe. In Seattle, the persistence of problems has managed to shift the conversation entirely: repeated collisions and disruptions have resulted in new extensions no longer using street-running tracks at all, and more recently, there has been a fierce debate about whether the street‑level segments on the existing “1 Line” should be removed and replaced with elevated or trenched tracks instead.
Below is a selection of incidents that have occurred on other street-level light rail systems in Canada and the U.S.:
| City | Date | Outage duration | Incident notes |
|---|---|---|---|
| Calgary | 2024 Oct | "Several hours" | Pedestrian struck; shuttle bus chaos |
| Calgary | 2018 Oct | >3 hours | Pedestrian struck (third incident that month) |
| Calgary | 2018 Oct | >3 hours | Child struck and killed by train |
| Edmonton | 2018 Sept | >4 hours | Pedestrian trapped under train, later died of injuries |
| Edmonton | 2024 Sept | 2.5 hours | Vehicle drove onto tracks; collision |
| Kitchener‑Waterloo | 2023 Jul | 2 hours | Vehicle/train collision |
| Portland, OR | 2018 Sept | >11 hours | Derailed streetcar; cranes required to re‑rail vehicle |
| Seattle, WA | Aug 2025 | 5 hours | Fatal collision; major disruption |
| San Jose, CA | 2018 Jul | >16 hours | High-speed multi vehicle crash at crossing |
| Calgary | 2018 Sept | ~2.5 hours | Pedestrian collision; dragged several stations before discovered |
| Edmonton | 2025 Dec | 2 hours | Pedestrian struck by Valley Line train |
| Edinburgh, Scotland | 2018 Jun | >24 hours | Bus collision; derailment and major track damage |
| Portland, OR | 2018 Jul | 2 hours | MAX LRT sideswipe collision with trucks |
| Jersey City, NJ | 2018 Jun | ~2.5 hours | Train/vehicle collision |
| Minneapolis–St. Paul, MN | 2025 Mar | 2 hours | Pedestrian struck on Green Line |
| Seattle, WA | 2025 Nov | 1.5 hours | Vehicle/train collision |
| Sacramento, CA | 2018 Jun | >4 hours | Cyclist struck; impassable tracks |
| Kitchener‑Waterloo | 2021 Sept | "Several hours" | Vehicle/train collision |
| Toronto | 2018 Sept | >2 hours | Streetcar derailment after collision with ambulance |
| Los Angeles, CA | 2024 Apr | 4.5 hours | Train/bus collision; many injuries |
(This table is a representative sample drawn from documented media reports and incident logs; outage durations are the reporter‑stated estimates.)
The above examples often illustrated that when light rail trains were moving faster, the severity of the incident tended to be greater.
In Calgary and Edmonton, where trains run on exclusive rights‑of‑way at speeds often exceeding 80 km/h, collisions are frequently deadly in nature. However, speed matters on street‑running sections too: even at 50–60 km/h, impacts can produce catastrophic outcomes.
The Portland Streetcar example in particular was instructive. A single truck exiting a driveway collided with a streetcar that was travelling at roughly 30 mph (50 km/h), becoming damaged so badly that emergency responders had to extract its driver using the jaws of life. Streetlights, electrical posts, and two other parked vehicles on the street faced collateral damage. The impact derailed the light rail vehicle and required a crane to re‑rail it, producing an 11‑hour service outage during which passengers were forced onto shuttle buses. That single event shows how a relatively small object in the path of a moving rail vehicle can trigger a long, resource‑intensive recovery.
Now imagine a similar collision involving a two- or three‑car LRT consist on Eglinton: heavier vehicles, more passengers, more complex vehicle systems, and a much larger operational footprint. The time, equipment and personnel needed to recover would scale up accordingly.
It’s a simple matter of physics: kinetic energy grows with the square of speed, and so a modest increase in velocity produces a much larger increase in collision energy. Lowering intersection speeds, therefore, reduces collision energy; the likelihood of derailment; the severity of injuries; and the time needed to clear the scene and restore normal service—which appears to be the trade‑off the TTC is making: a modest, predictable slowdown now in exchange for a lower probability of catastrophic, long‑running outages later.
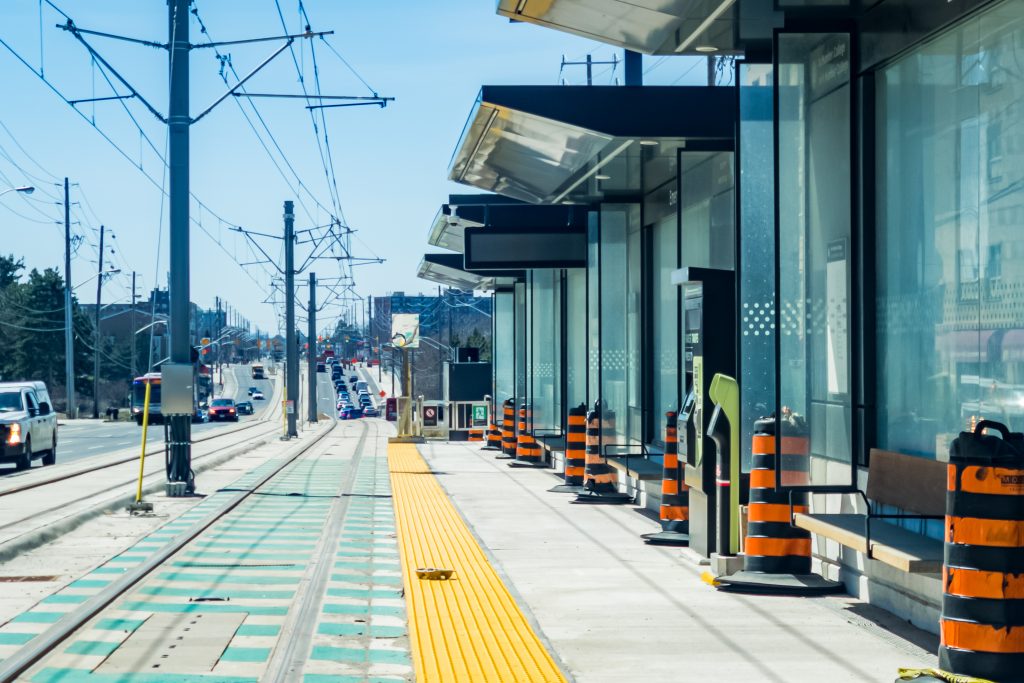
Toronto’s use of street‑running light rail as part of its backbone rapid transit network makes these risks more acute. During planning, LRTs were often sold as a cheaper alternative to subways: lower capital cost (supposedly), faster construction (again, supposedly), and adequate capacity for many corridors on which subways and metro lines were framed as likely to be “overbuilt”. These pitches had political appeal, but they also depended on the assumption that at‑grade operation would be acceptably reliable, which has clearly turned out not to be the case.
Now, thousands of riders will rely on Line 5 every day. Developers are already banking on that demand: new residential towers and commercial projects in areas such as the proposed Golden Mile district assume dependable transit access. If the line suffers frequent, long outages, the economic and social costs ripple beyond the TTC’s balance sheet — they affect housing markets, local businesses, and commuter behaviour.

Operationally, a major Line 5 disruption would consume more buses than the TTC can spare without degrading service elsewhere. That means riders on other routes—potentially in neighbourhoods with no direct connection to the Crosstown—could see their service reduced while buses are diverted to provide shuttle service. Overcrowding becomes immediate: platforms and shuttle buses fill, dwell times increase, and the agency’s ability to restore normal service is constrained by fleet and crew availability. The result is cascading delays across the network and a visible failure of reliability that erodes public trust.
The political fallout from that kind of network‑wide impact can be significant. When riders repeatedly encounter long, poorly managed outages on a critical backbone line in the city’s network, faith in the transit system stalls. Commuters begin to budget extra time, employers complain about lateness, and developers start to question the reliability assumptions baked into new projects. Restoring confidence after a high‑profile outage is expensive and slow; it requires demonstrable operational improvements, not just promises.
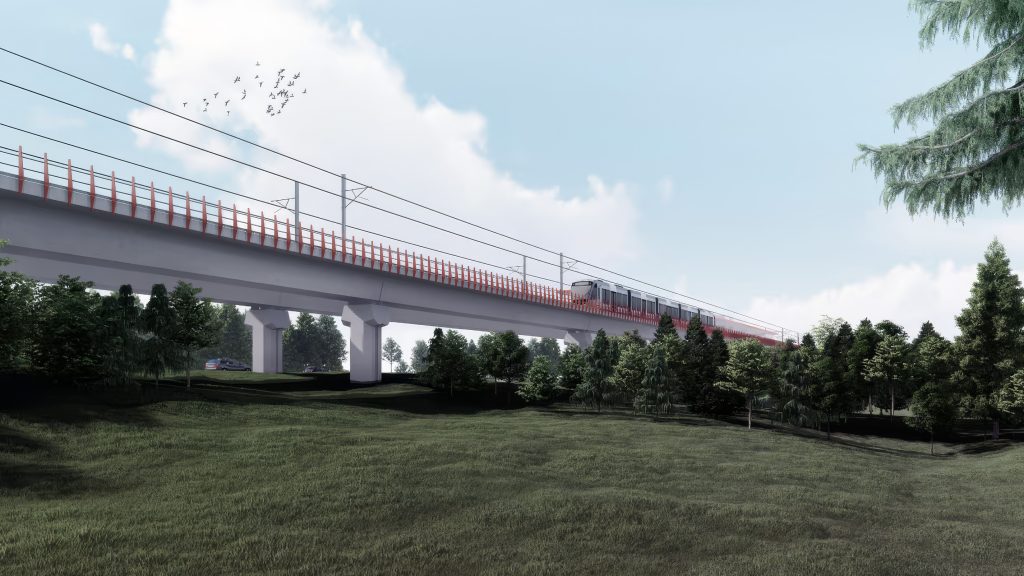
There is a blunt, structural answer to the problem: grade separation.
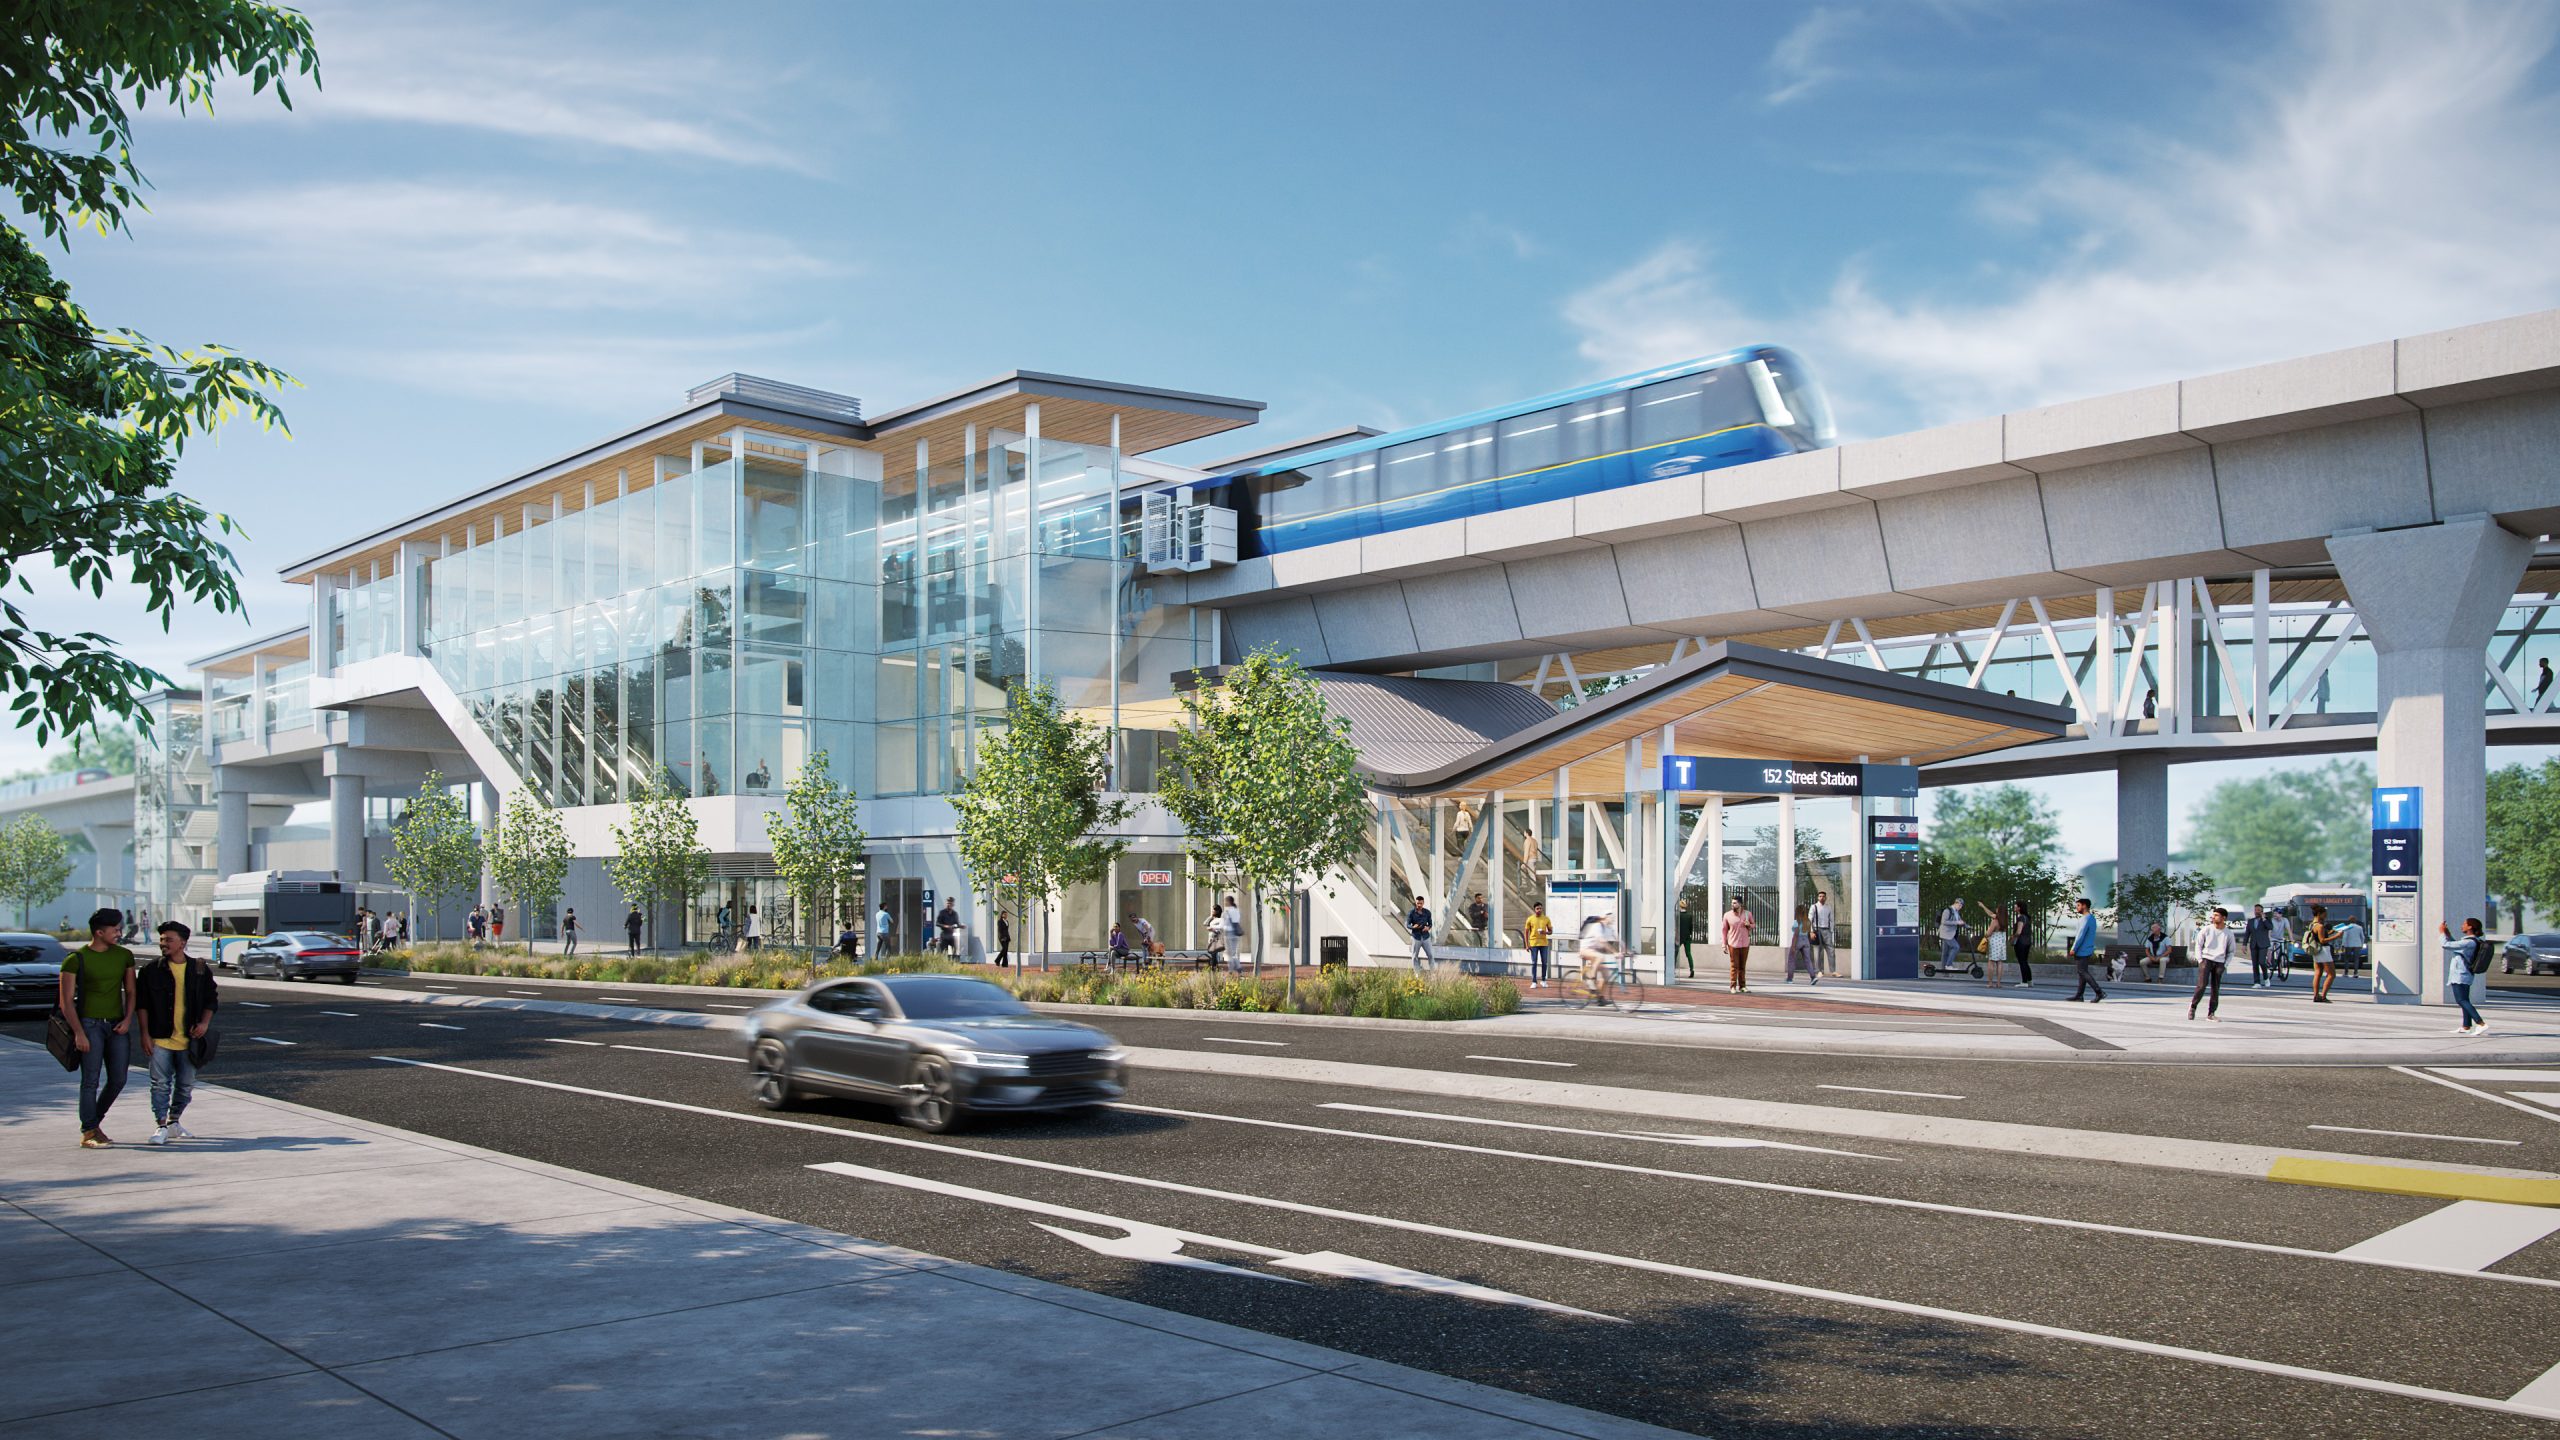
Here in Metro Vancouver, we have long demonstrated that fully grade‑separated rapid transit dramatically reduces the frequency and severity of collisions, and it preserves service continuity. Grade separation is often not as politically easy, and can often come with bigger budgeting and planning commitments, but it is the only way to remove the at‑grade collision vector entirely for rapid transit projects.

We understand the counterarguments. Bridges and tunnels raise capital budgets during planning and can complicate project delivery. Proponents of at‑grade LRT systems point to lower upfront costs and faster construction timelines. However, the experience of Toronto’s Line 5 and Line 6 shows that the promised savings of LRT are often an illusion. Line 5’s long delivery timeline and cost pressures, and Line 6’s overruns and limited travel‑time benefits compared to buses, illustrate how the “cheap and fast” narrative can break down in practice.
While it’s too late to change the course for Lines 5 and 6 in Toronto, the lessons can certainly be applied to future corridors. The calculus should include the full lifecycle cost of outages: the economic cost of lost time, the expense of emergency recovery, the political cost of lost trust, and the social cost of unreliable mobility. When those factors are included, grade separation often becomes the more rational long‑term investment.
The TTC and Mayor Olivia Chow have pointed to the agency’s long experience operating streetcars and buses as a reason to trust the soft‑launch decisions. That institutional memory matters, but experience can cut both ways: it can either justify cautious, resilience‑focused policies like this one, or it can be used to defend decisions that prioritize short‑term optics instead of long‑term reliability.
If the 25 km/h intersection speed limit is indeed a deliberate resilience measure, then it is a defensible one. However, if it is merely a bureaucratic legacy holdover, then the TTC should explain why it persists—and publish the data that supports it. Either way, Toronto’s experience should be a wake‑up call for all other Canadian cities: if you are going to rely on street‑running light rail as a backbone transit mode, you must plan for the operational realities that come with it—and be honest about the trade‑offs.
For Line 5 riders, when the line finally opens this coming Sunday after 15 years, the immediate asks are simple: the TTC should publish clear resilience metrics, explain the rationale for speed policies, and demonstrate that it has the equipment, crews, and contingency plans to recover quickly from incidents. For planners and politicians, however, the lesson is broader: if you want a reliable, rapid transit backbone, the safest long‑term choice is to build up. Even when grade separation is expensive, the cost of repeated, network‑crippling outages is higher still.
Pictured in header: Accident between Toronto TTC streetcar and a vehicle
Reality Check
Reality Check is the online blog run by the founder of SkyTrain for Surrey, a BC-based community organization that has advocated for the expansion of the Vancouer SkyTrain system, including our successful advocacy for the under-construction Surrey-Langley SkyTrain extension.
Media Contact: Daryl Dela Cruz – Founder, SkyTrain for Surrey ・ Phone: +1 604 329 3529, [email protected]
We use cookies to improve your experience on our site. By using our site, you consent to cookies.
Manage your cookie preferences below:
Essential cookies enable basic functions and are necessary for the proper function of the website.
Statistics cookies collect information anonymously. This information helps us understand how visitors use our website.
Google Analytics is a powerful tool that tracks and analyzes website traffic for informed marketing decisions.
Service URL: policies.google.com (opens in a new window)
You can find more information in our Cookie Policy and .