Menu
 Daryl DC (SfS Founder)
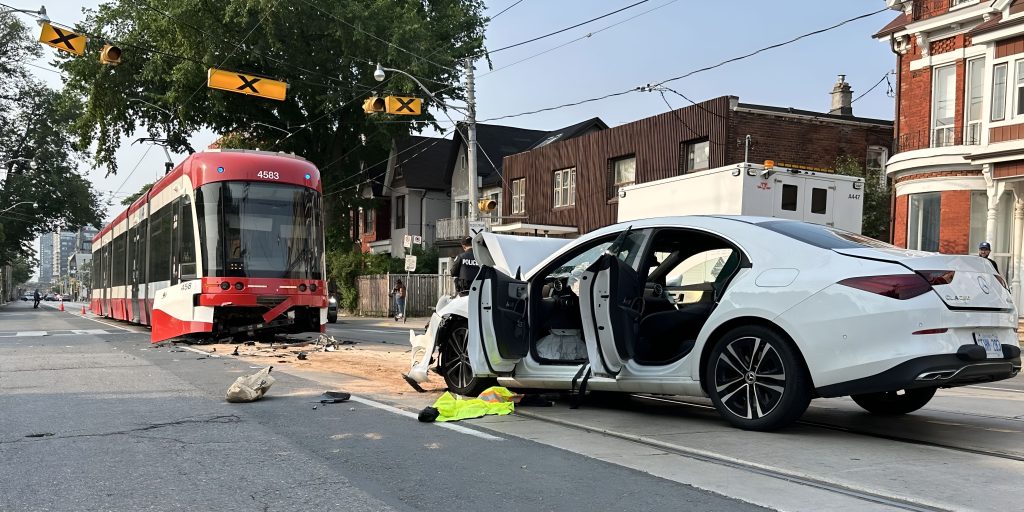
Many of our followers are already familiar with the saga of Toronto’s Line 6 Finch West LRT — whether from our own coverage when the line opened or, more likely, from the steady stream of national news stories highlighting its serious reliability and speed problems.
Yet despite this very public record, some pro‑LRT voices in Toronto continue to argue that Finch West’s failure to meet its travel‑time targets is a uniquely “TTC problem,” rooted in local operations practices rather than the technology itself. My long‑standing observations of surface LRT systems across North America tell a very different story. As I noted in our earlier “Reality Check” blog post, even Seattle’s Link LRT system is struggling with slower‑than‑promised travel times, though to a lesser extent.
Today, I want to turn to another case that illustrates the same pattern even more clearly: the Minneapolis–St. Paul Green Line.
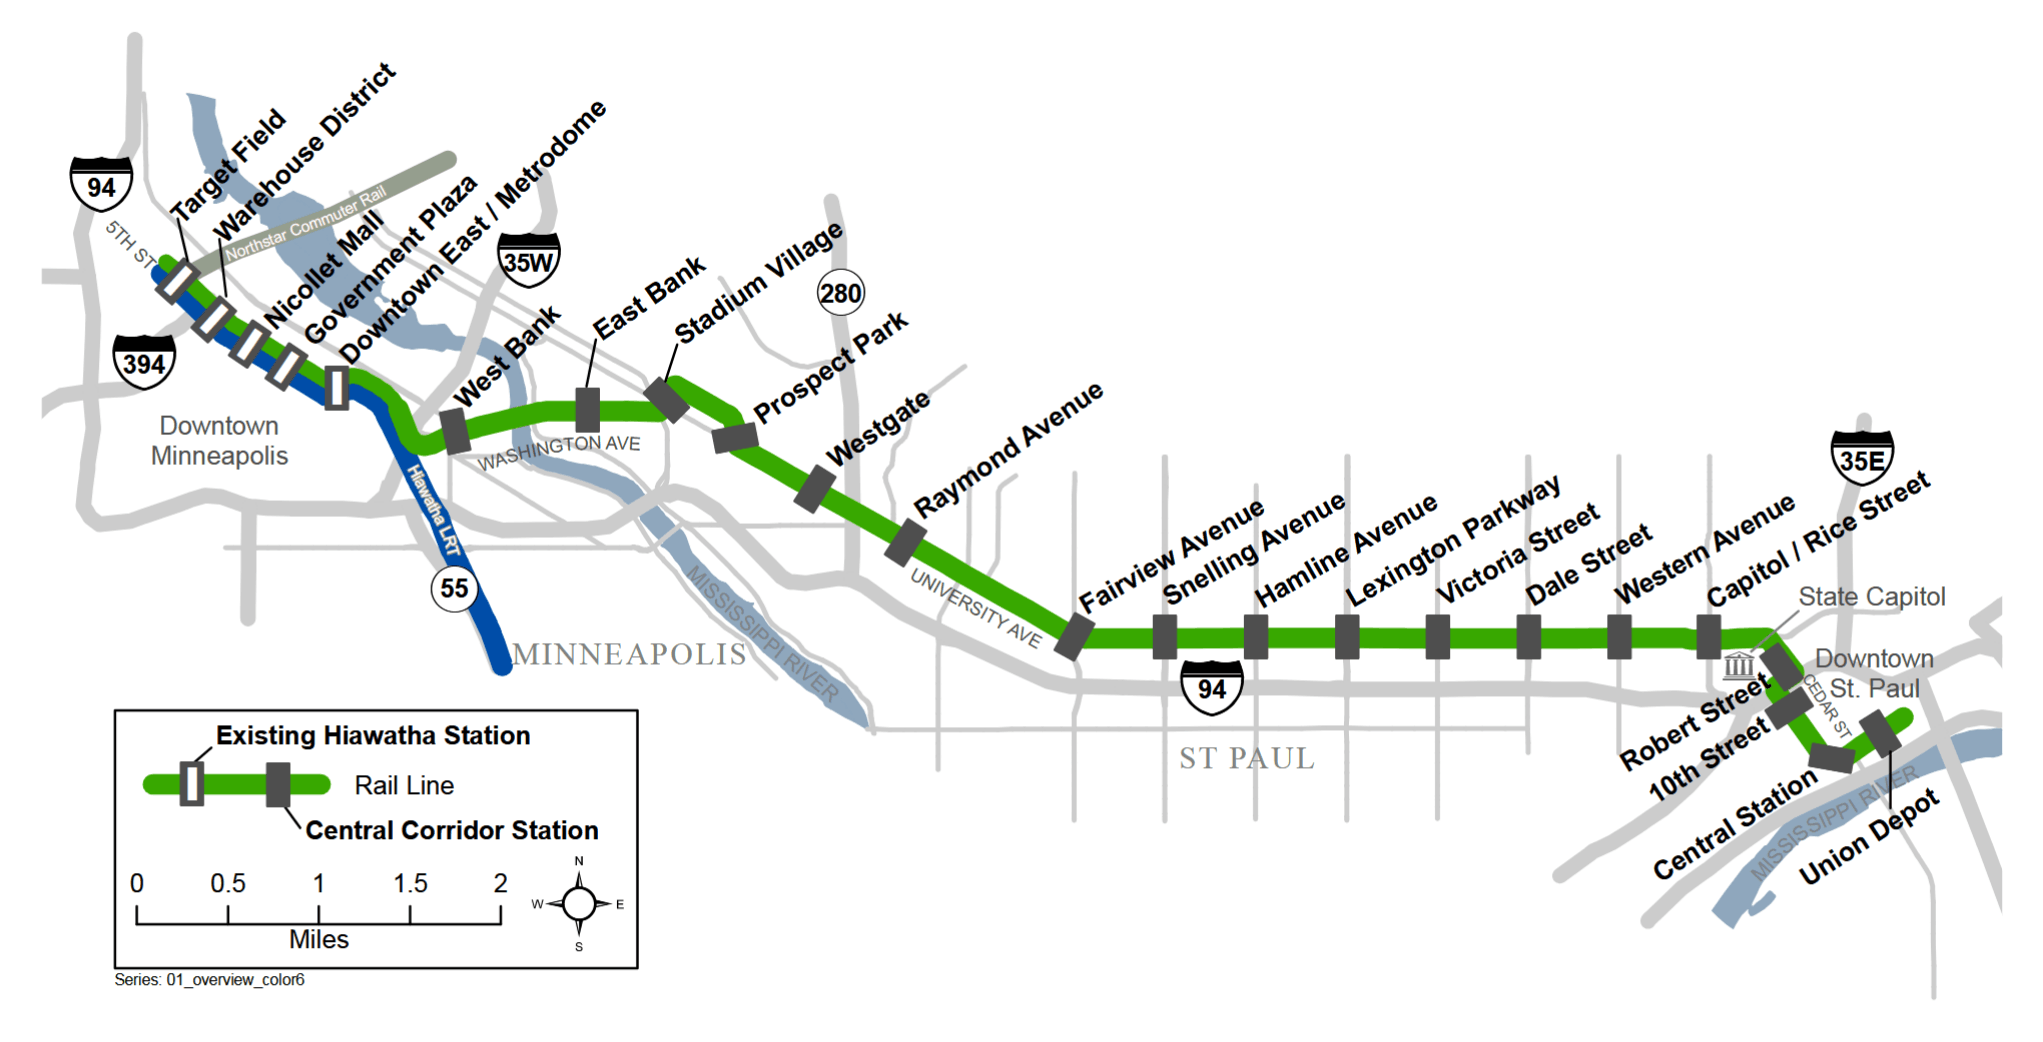
Opened in 2014 as the Central Corridor LRT, the 18 km (11-mile) Metro Green Line links downtown Minneapolis and downtown St. Paul—the two major centres of the Twin Cities region. Conceived as a transformative east‑west spine, it connects five major activity hubs: downtown Minneapolis, the University of Minnesota, the Midway district, the State Capitol, and downtown St. Paul.
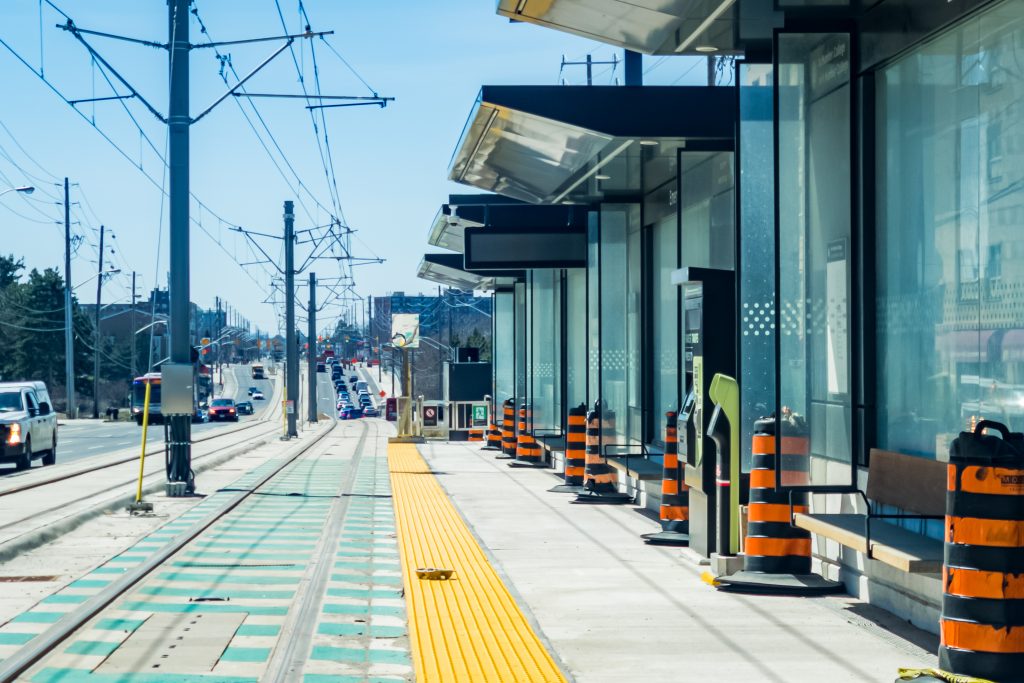
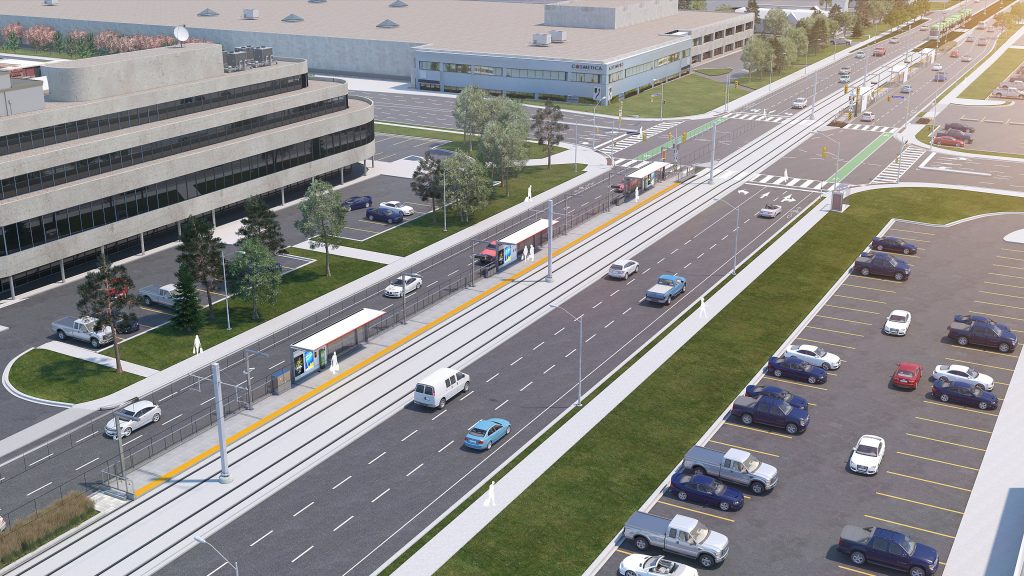
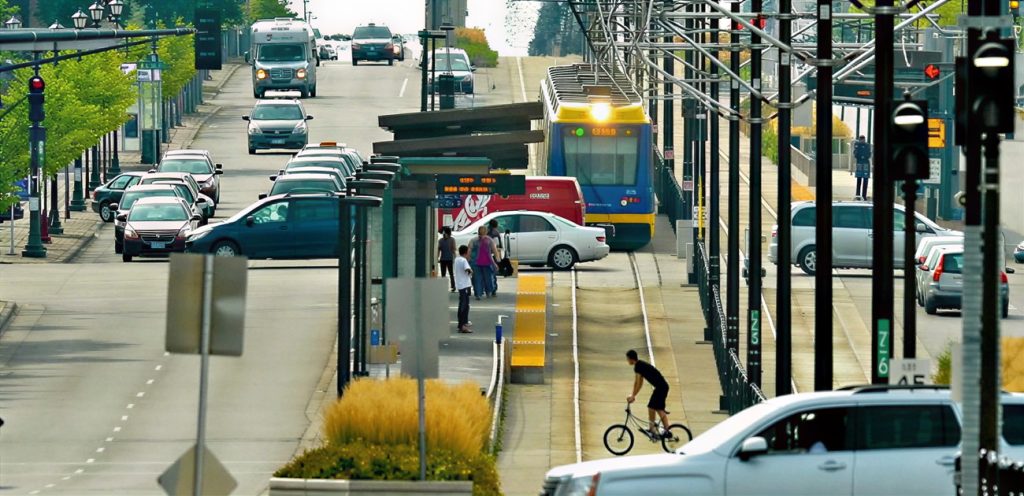
Unlike the region’s first LRT line, the Metro Blue Line (2004)—which runs on an exclusive rail corridor—the Green Line was built almost entirely in the median of University Avenue, an arterial roadway linking the two cities. Its at‑grade, street‑running design closely resembles Toronto’s Finch West LRT and depends heavily on traffic‑signal coordination to maintain speed.
During original planning, the Green Line was projected to complete its end‑to‑end trip between Target Field in Minneapolis and Union Depot in Saint Paul in just 35 minutes[1], averaging 31 km/h (19.25 mph); this was later revised to 39.6 minutes[2]. However, as testing began, those assumptions quickly fell apart. One month before opening, dry‑run trains were taking roughly 67 minutes due to poorly tuned signal priority and intersection timing, mirroring the same issues now seen on Finch West.
As it turned out, the original estimates were based on optimistic assumptions about signal priority and minimal cross‑traffic delays[3], and it became evident that those faster travel times were not realistically attainable on the final LRT line as it was built.
As in Toronto, local advocates scrutinized the travel times and collected data [4][5] to compare the LRT’s performance to the existing bus routes on University Avenue—the #16 (local) and #50 (express)—and to determine whether the new line would actually deliver faster travel times. Rider groups banded together, lobbying local governments to fix signal priority issues and ensure results from an investment of nearly $1 billion USD.


Above: Samples of data collected by transit advocates comparing Green Line expected times with existing bus times.
Note that times shown above, including the Green Line, reflected expected and not actual travel times on all charts (more clarification on this below)
Upon opening, Metro Transit was able to schedule trips for 48 minutes[6][7]—averaging only 22 km/h (13.75 mph) between the two downtowns. While faster than the 67‑minute test runs, this fell far short of the original planned projections of 35 minutes from end-to-end, and offered only a minimal improvement over the Route #50 express bus. In addition, to cut costs and reduce the number of light rail vehicles required for service, Metro Transit opted to run trains at lower 10-minute frequencies instead of the earlier planned peak-hour frequencies of every 7.5 minutes—reducing service on the existing Blue Line LRT too in the process.[8][9]
Ultimately, the Green Line LRT proved to be only 2 minutes faster than the 50-minute scheduled runtime of the bus service that it replaced.[10]
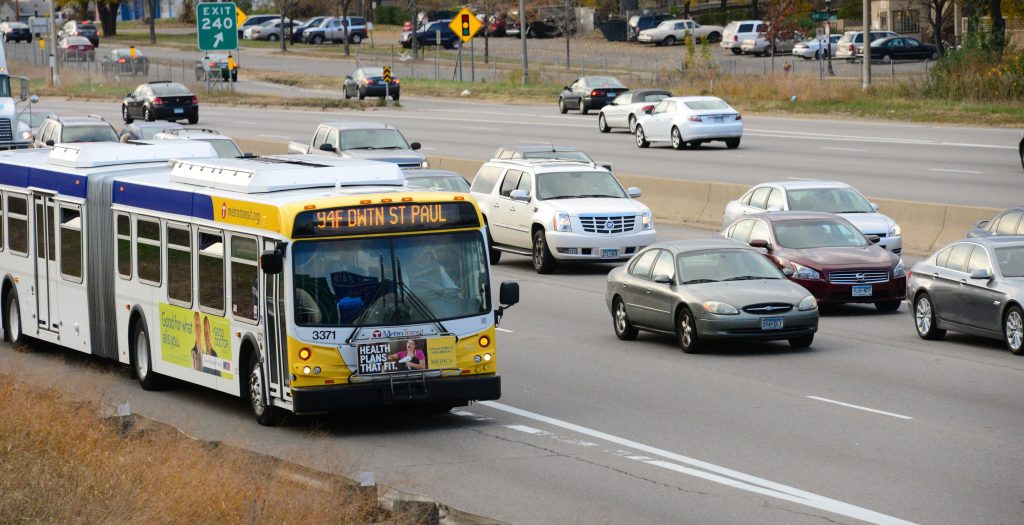
Worse yet, as noted by transit rider groups, the Green Line offered no speed advantage over the region’s existing express highway service on the I‑94 freeway just a few blocks south. (The Route #94 express bus reliably connected the two downtowns in 25-30 minutes[4][5][7], aided by bus‑only shoulder lanes[11]—similar to the Highway 99 shoulder‑running design used by the #351 bus in South Surrey).
Adam Platt, MinnPost
Will Metro Transit’s Green Line really replace 500 bus trips?
Torontonians hoping for a quick fix to the Finch West LRT’s travel-time problems should be warned that the Minneapolis example shows that only little progress may ultimately be made. More than a decade after opening, the Green Line’s travel time has not meaningfully improved. Operational tweaks briefly reduced the scheduled trip from 48 to 45 minutes in 2015[12], but by July 2020 this had climbed back up to 46.5 minutes[13], and by October 2025 again to 49 minutes[14]—longer than the travel time on opening day.
A major reason is the persistent failure of the line’s transit signal priority (TSP) system. While issues with TSP were noticed by many early on as the system began operation[15], local media were still calling out the same unresolved issues with TSP and overall travel times as recently as 2024[16]. Much like Toronto’s Line 6, Green Line trains are routinely forced to wait at intersections where turning vehicles are prioritized over transit—and this has remained unfixed for more than ten years.
Despite significant issues, the Green Line is often called a success because it managed to meet and exceed ridership projections (Ridership projections were for 41,000 daily riders by 2030, and actual daily ridership surpassed that count by April 2016[13]). However, attaining these outcomes ultimately came at the expense of existing transit riders and regional ridership growth.
Advocates warned that Metro Transit would eventually cut the Route #94 interstate bus service to force riders onto the slower Green Line light rail, and that prediction proved correct. With the Green Line’s launch, Route #94 lost its all‑day service, retaining only weekday peak and limited midday trips, while evening and weekend service was eliminated. Midday service had also been set to be eliminated, but was retained at the last minute after plans to cut back the Route 94 service received significant public backlash[17][18].
The local Route #16 bus route on University Avenue, meanwhile, was truncated at the University of Minnesota—meaning riders bound for Downtown Minneapolis had to either choose the light rail instead, or otherwise transfer to/from either the light rail or another bus.[18]
Although the Green Line was widely viewed as a ridership “success”, Metro Transit’s overall system saw ridership fall in the years that followed. Bus usage began declining almost immediately after the line opened—partly because bus riders shifted to the Green Line (including due to the service cuts on Routes #94 and #16), and partly because the arrival of rideshare apps like Uber and Lyft in 2014 had introduced new competition for short‑ and medium‑distance trips.
")


Metro Transit’s own charts illustrate the trend clearly[19][20][21]. Systemwide ridership peaked in 2015, then steadily declined, returning by 2019 to pre-Green Line levels. A second chart shows the dynamic more sharply: during the Green Line’s first two years, its rapid ridership growth coincided with a steep drop in bus ridership. After that initial shift, Green Line growth flattened while bus ridership continued to erode.
Future Twin Cities projects should prioritize dedicated right‑of‑way and end‑to‑end speed over curbside placemaking if the goal is to shift regional travel behavior; the good news is, it appears that the challenges of the original Green Line have fundamentally shifted the design philosophy for Minneapolis’s next generation of transit—offering lessons that could potentially be applied in Toronto.
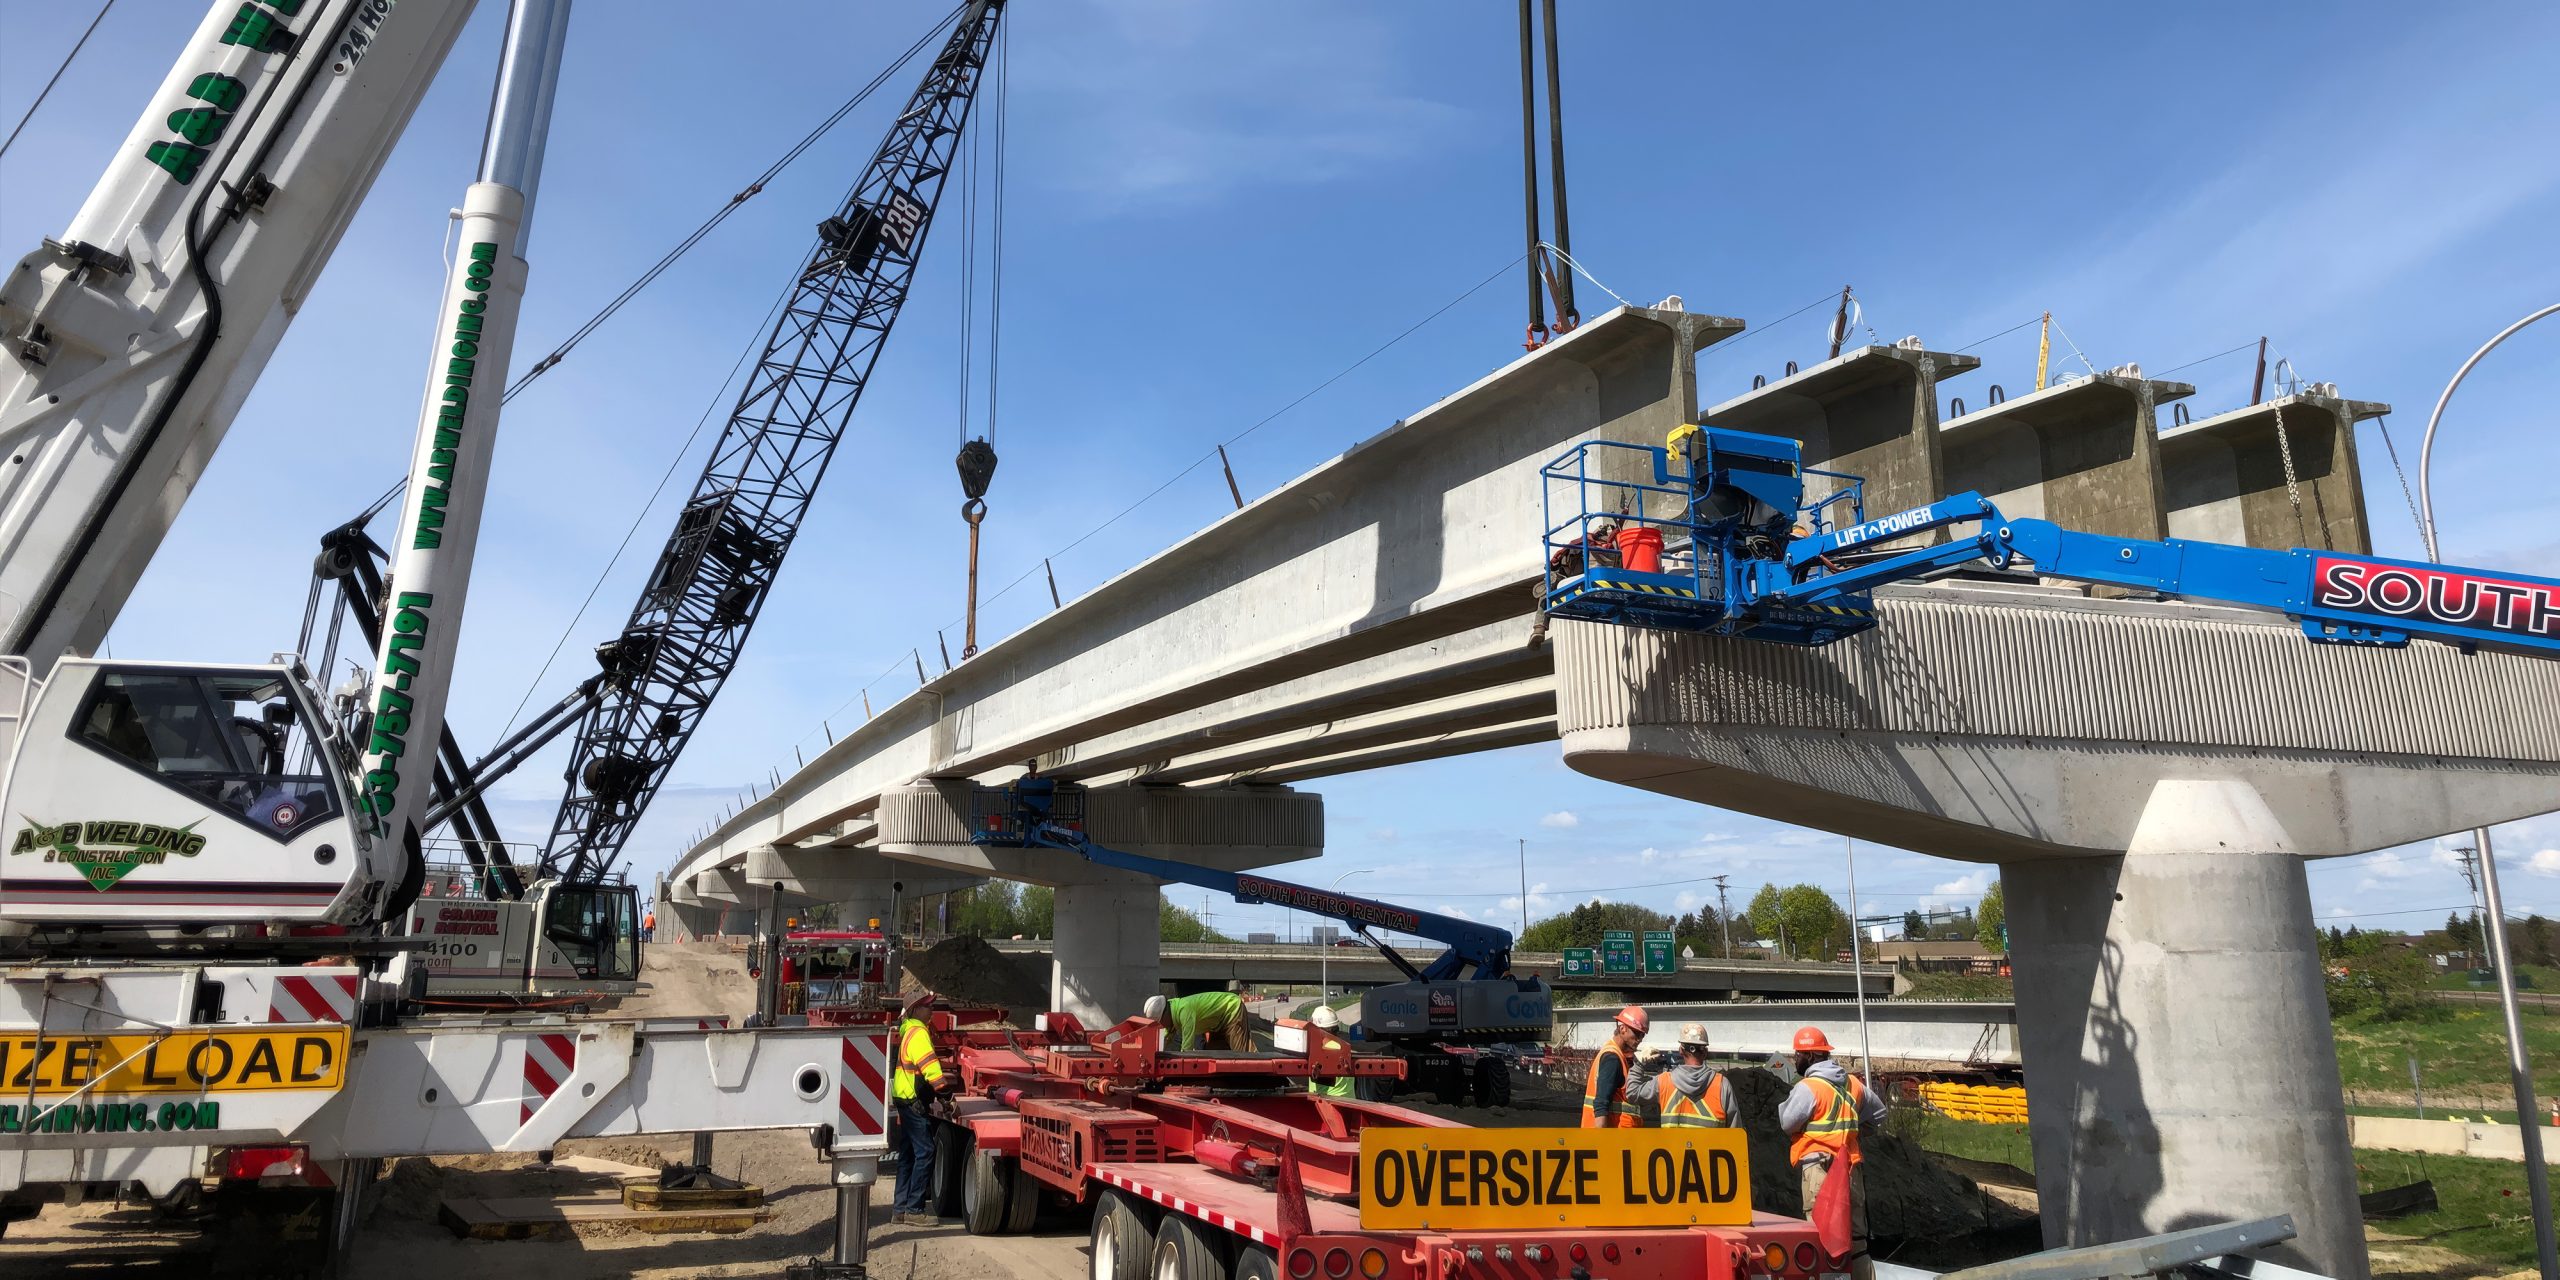
The Southwest LRT, a 23.3 km (14.5-mile) extension of the Green Line west to Eden Prairie, reflects a return to planning for higher speed. Unlike the street-running segments of the Central Corridor, the Southwest extension uses an exclusive right-of-way with extensive grade separations, including tunnels and elevated guideways, enabling the trains to reach their full speed of 90 km/h (55 mph). These design choices, which decouple the LRT from city traffic, enable an average speed of 43.7 km/h (27.2 mph) and an end-to-end travel time of approximately 32 minutes[22] (recall that the current Green Line on University Avenue takes 48 minutes—50% longer over a shorter distance).
Simultaneously, the Gold Line BRT—which began service between downtown St. Paul and Woodbury to the east in March 2025—is being leveraged to bypass the Green Line’s inherent speed bottlenecks.
In October 2024, Metro Transit announced the westward extension of the Gold Line to downtown Minneapolis along the I-94 freeway, providing a fast, frequent, and all-day rapid transit connection between the two downtowns, superseding the Green Line LRT.
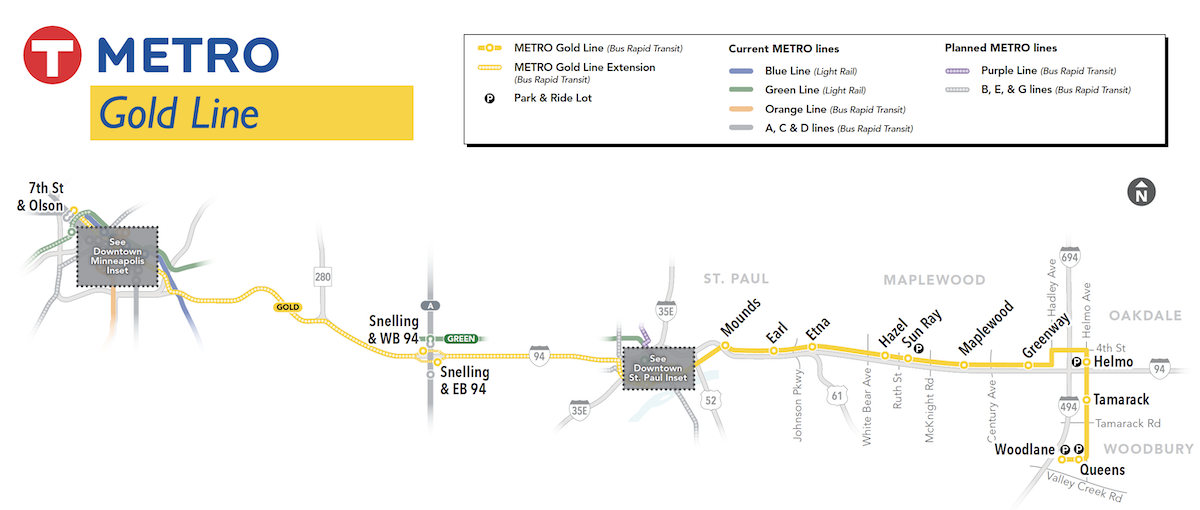
Scheduled for completion in 2027 at a cost of just $20 million USD, this project demonstrates a pivot toward flexible, freeway-based rapid transit to provide the higher speed and reliability that surface LRT has struggled to deliver. It will utilize and extend the existing bus-on-shoulder lanes and dedicated freeway infrastructure along I-94[23] to effectively upgrade the Route #94 bus to a rapid transit standard. It will also interline with the existing Gold Line segment, meaning that riders who would normally transfer to the Green Line LRT to continue into downtown Minneapolis would have a one-seat ride on the bus—a decision that will likely reduce Green Line ridership.
Ahead of the Gold Line BRT’s introduction, the missing evening and weekend service on Route #94 was restored in June 2025 after more than a decade of calls from transit advocates—an effective admission that the previous decision to cut service was a mistake.
I can see the “Gold Line extension” model applied in Toronto to address challenges with the beleaguered Line 6 Finch West LRT. Nearby freeway, railway, and utility corridors could provide the rights-of-way necessary for rapid bus infrastructure, offering bypass or express services to key destinations like Humber College at the line’s western terminus.
While this approach might seem to undermine the billions already invested in the Finch West LRT, it offers a pragmatic way to more quickly offer improved transit service in the area—a solution local policymakers should seriously consider.
Ultimately, the story of the Green Line serves as a cautionary tale for modern urban planning: transit cannot achieve significant mode shift if it fails to respect the “time-competitiveness” of the commute. By pivoting toward exclusive rights-of-way for the Southwest LRT and high-speed BRT corridors for the Gold Line, Metro Transit is finally acknowledging that for public transit to be a viable regional option, it must move faster than the traffic it aims to replace. This is a critical lesson applicable across both Canada and the United States.
Pictured in header: A Minneapolis Green Line LRT train
Reality Check
Reality Check is the online blog run by the founder of SkyTrain for Surrey, a BC-based community organization that has advocated for the expansion of the Vancouer SkyTrain system, including our successful advocacy for the under-construction Surrey-Langley SkyTrain extension.
Media Contact: Daryl Dela Cruz – Founder, SkyTrain for Surrey ・ Phone: +1 604 329 3529, [email protected]
We use cookies to improve your experience on our site. By using our site, you consent to cookies.
Manage your cookie preferences below:
Essential cookies enable basic functions and are necessary for the proper function of the website.
Statistics cookies collect information anonymously. This information helps us understand how visitors use our website.
Google Analytics is a powerful tool that tracks and analyzes website traffic for informed marketing decisions.
Service URL: policies.google.com (opens in a new window)
You can find more information in our Cookie Policy and .